Ford Mustang GT (Model Year 2010)
When it comes to affordable sports cars, Americans’ love affair with the Ford Mustang family knows no bounds. Mustang’s 2010 GT coupe, encompassing its fifth generation design, muscular 315 HP, 4.6L V8 engine with a manual transmission, offered sports car lovers a scintillating and awe-inspiring choice and experience, leaving a big portion of the competition far behind.
While the standard GT package provided for 5-speed manual transmission, leather appointment, advanced power package, climate control, heated mirror, eight-speaker entertainment, Bluetooth, etc., automatic transmission, glass roof, convertible accessory and read video camera were popular options. Also, 3-year/36K miles basic and 5-year/60K miles drive-train with roadside assistance were standard warranties.
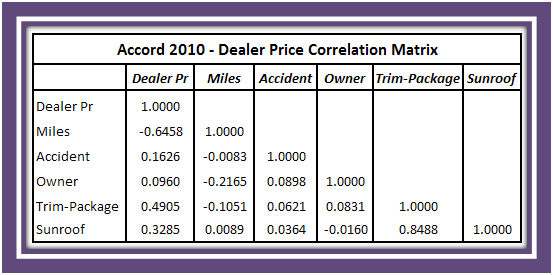
Modeling Step 1 (Correlation Matrix)
 |
| (Click on the image to enlarge) |
The above correlation matrix demonstrates that the Dealer Price (Dealer Pr) has the highest (negative) correlation with Miles, meaning the higher miles on the vehicles tend to dampen the dealers’ asking prices in the market.
Mustang GT Convertibles have more positive impact on the price than the regular coupes. While the GTs without any reported accidents (Accident) are expected to fetch higher price than their counterparts, the high mileage ones would be adversely impacted due to their high negative collinearity with Miles. Likewise, the single owner (Owner) GTs would do better price-wise than their counterparts. Though the better maintained GTs (Service) are expected to have positive effect on price, its high multi-collinearity with Miles and Accident would drain its impact. Warranty is virtually uncorrelated with price.

The above scatter graph depicts the usual negative relationship between the Dealer Prices and Miles. Prices generally decrease commensurately with the increasing mileage. Thus far, this graph is the only one that has demonstrated somewhat logarithmic (non-linear) relationship; nonetheless, this fit would be much tighter with the trimming of some outliers, thus paving the way for a much higher R-square, perhaps to a more customary level.
Modeling Step 2 (Multiple Regression Analysis)
The model R-square – 0.9595472 – is reasonably high, with potential for even higher R-square if the model is rerun without the outliers.
The above MRA output confirms the negative contributory relationship between Miles and the dependent variable, meaning higher miles are negatively contributing to the predicted prices. Though the Miles coefficient is seemingly small, it will nonetheless have reasonable impact on cars with high mileage; for example, the predicted price of a 2010 GT with 100,000 miles will be reduced by -$2,429 (-0.024289 * 100,000), as opposed to a mere -$486 for a competing one with only 20,000 miles on it.
Accident is the most important independent variable (highest t stat and lowest P-value) in the model followed by Convertible, Owner, Service and Warranty. Again, the standout presence of Accident points to the fact that it provides the maximum price differentiation between the accident-free and accident-encountered groups. Simply put, the future owners of these fairly late model sports cars are most likely risk-averse, and as a result are unwilling to pay the high market price either for the high mileage cars or those that have encountered major damages or accidents.
To interpret the other Model coefficients: Convertible GTs are retaining more value than the regular coupes; the single owner vehicles are preferred to multiple owners’; the well-maintained cars provide the necessary peace of mind for the buyers as they are willing to pay for the good service (service maintenance by the manual, garage kept, etc.), while any warranty services are enhancing predicted prices.
The MRA Model is confirming the presage of the correlation matrix that Service and Warranty are the two least contributing predictors. Again, higher miles and accidents have perceptibly negative impacts on predicted prices.
Modeling Step 3 (Analysis of Model Estimates)
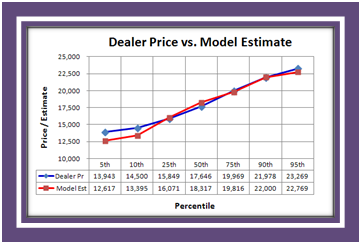
The above percentile graph shows that while the model estimates are significantly lower at the bottom end of the curve (5th and 10th), they are however in tandem between 25th and 90th, though diverging slightly at the 95th. The fact that the model has been predicting lower prices at the bottom end of the curve points to the above-the-market asking prices for the lower end units, perhaps those with multiple incidences – accidents on record, multiple ownership, inadequate maintenance or high mileage.
On the other hand, this additionally proves that the model estimates could help both consumers and dealers to quickly converge on the same page as these estimates are independently derived. Likewise, the private sellers can validate their subject prices before accepting the trade-in values from the dealers, considering that these are generally high-priced sports vehicles and local comps could be few and far between.

The above Warranty table shows that while the dealers are over-pricing the vehicles without any warranty (None), they are however under-pricing the vehicles under warranty – factory re-certified (Certified) or those with in-house (Dealer) warranties. Specifically, they are significantly under-pricing Certified and Dealer warranty vehicles roughly $1,550 and $1,000, respectively. On the other hand, the Model is showing that the Vehicles without any warranty are the least preferred, thus predicting roughly $700 below the current asking. Interestingly, the vehicles with the dealer warranty have the highest mileage – 28K more than the Certified inventory.

While the Model is confirming the dealer pricing for the fleet without any reported accidents (None), the dealers are however way over-pricing the ones with the reported accidents (Yes), even those with the minor damages. Therefore, by having the model estimates placed alongside the dealer prices, consumers could save on average $3,916 (16,465 – 12,549) and $1,434 (15,749 – 14,315), respectively. More troublingly, the mileage difference is incredible between the yea and the nay categories.

The Model also proves that the one owner vehicles are expected to fetch premium prices, though the dealers are pricing the 2-3 ownership cars higher than the original owners’ with fewer miles. Vehicles with 4+ owners are also priced above the market. Again, this transposition of prices could be avoided if they were to subscribe to some legitimate model values. Moreover, in this internet day and age, by having the model estimates available side-by-side the dealer prices, dealers would protect average consumers as well as their reputation and thus ease deal-making by eliminating all unnecessary price haggling back and forth.

Though the dealers are asking more or less the right market price for the well-maintained vehicles, they are however asking $2,500 more for the vehicles with sub-par service history. Needless to say, absent some model values alongside the dealer prices, buyers would continue to overpay for the lesser maintained vehicles. Therefore, this industry needs to be reinvented by having to publish a set of independent model values side-by-side the dealer’s asking prices.

The above Miles table illustrates the price comparison by having miles broken down into four (equal) quartiles. While the Model is forecasting the inverse relationship between the predicted prices and mileage, dealers’ asking prices are not too far off, either. Dealer prices in the low mileage quartile are somewhat higher than the model estimates, apparently stemming from the lure of the low mileage vehicles. The fact that the consumers are forced to pay an unwarranted premium could be avoided if the model estimates were also published alongside the dealer prices.

The Model is proving that the location arbitrage is virtually non-existent nationally, though the West Coast dealers are asking somewhat higher prices than the corresponding model estimates. The reason the Model is estimating the lowest prices for the West Coast cars is the highest average mileage on those vehicles; for instance, West’s average mileage of 69,904 is significantly higher than Central’s 50,428 or East’s 52,897 while the price gap narrows between West’s and South’s due to the tapering of their respective mileages.
The Convertible GTs (Yes), along with their lower mileage, are fetching premium prices than the regular coupes. While the Model is predicting even higher prices for them, it is lowering the threshold for the competing regulars. Of course, the Convertible was an option for the new 2010 GTs with a MSRP of $33,395, as compared regular GT coupe’s $28,395. A part of the original premium might still be carrying over.
Of course, when the comparisons are not necessarily apples-to-apples, normalized metrics are in order. Decay in value could be one such metric. Applying the above figures, the Convertible has lost 34.50% (33,395-21,883)/33,395 in value off the original MSRP while the regular coupe has stacked up ever higher decay, i.e., 40% (28,395-17,067)/28,395.
The above data sample demonstrates that the dealers are randomly over-pricing the GTs given the general paucity of the late models. Unlike the previously researched Makes/Models where the dealers were routinely over-pricing the vehicles with the reported accidents, the GTs are seemingly all over the map, so to say.
Here is a quick breakdown of the sample:
5 (50%) vehicles have no record of accidents;
5 (50%) vehicles had 2 prior owners;
6 (60%) vehicles have ‘Excellent’ service history;
7 (70%) vehicles have under 60K miles (drive-train);
8 (80%) vehicles have no warranty (yet over-priced);
9 (90%) vehicles are regular GT coupes (yet over-priced).
If the model estimates were to be placed alongside the dealer prices, buyers would immediately know the extent of the over-pricing. Ironically, the worst sample case SL# 1 (No Warranty, Accident, 4 Owners, Low Service Maintenance and Highest Mileage) is the most over-priced!
When the modeling process identifies the under-priced cars, it’s pointing to some “upfront” savings for the consumers. This is an area where the dealers would be most benefited if they were to subscribe to some model estimates. The above sample shows that the dealers are perhaps (because not a scientifically-drawn sample) under-pricing their cream of the crop: Accident-free vehicles (100% in this sample), with the widest spreads attributed to those that are additionally backed by excellent service history (90%), 1-to-2 prior ownerships (80%), warranties (50%). higher value convertibles (40%) and lower mileage (30%).
As indicated before, now and then, the dealer prices could consciously be lower to factor in some minor negatives (rarely captured in the modeling database) or to address some imminent psychological breakpoints. SL # 1 could be one such psychological case where the dealer might have consciously lowered the price (2nd lowest price) as the vehicle is on the verge of reaching 100K miles, a big psychological milestone.
Given the everlasting popularity of the Ford Mustang family of sports cars, the 2010 GT model has steadfastly remained one of the most sought after “affordable” late model sports cars on the market today.
Copyrighted Material