Pricing "Mid-Age" Model -- 2010 Accord Case Study
Alongside Toyota’s Camry, Honda’s Accord has been immensely popular in the mid-size segment, for over twenty years now. The reliability of the Accord has paid big dividends among its loyalists, always willing to lend a hand to their favorite car to remain on the top-10 lists of almost all major auto magazines ever since. Accord consistently fetches one of the highest resale values in the mid-size segment.
The 2010 Accord came in three primary trims: LX, EX and EX-L, with EX leading the production and sales. EX-L represented the top of the line with a V6 engine, sunroof, upgraded audio, leather and a luxury power pack. Even at the bottom of the Great Recession, over 280K 2010 Accords were sold, although 350K-390K used to be the norm prior to the recession.
Modeling Step 1 (Correlation Matrix)
 |
| (Click on the image to enlarge) |
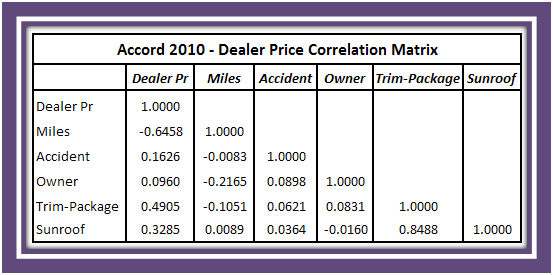
The above correlation matrix sets the table for modeling. Dealer Price (abbreviated here as Dealer Pr) has the highest (negative) correlation with Miles. The negative correlation coefficient signifies that higher mileage dampens the dealers’ asking prices in the market.
The Trim-Package variable demonstrates the second highest predictive relationship with the dependent variable, i.e., the Dealer Price. The binary Sunroof variable is the next best predictor but its demonstrably high multi-collinearity with the Trim-Package forces it out of the modeling equation, leaving Trim-Package to stand on its own in the model. Accident is the other important binary variable in the modeling queue, with extremely low collinearity with the other independent variables. Finally, the prior ownership (“Owner”) is another predictor of the dealer price. Owner is a linearized 4-category variable with 1-owner receiving the highest rating followed by 2, 3 and 4 owners, respectively.
The above scatter graph depicts the negative relation between Dealer Price and Miles. Prices generally decrease commensurately with the increasing mileage. With trimming of some outliers, the fit would tighten, moving the R-square up to a more customary level.
Modeling Step 2 (Multiple Regression Analysis)
The above MRA output confirms the transition of Miles from the negative predictive relationship in the correlation matrix to the negative contribution to the predicted price. Trim-Package is the most important independent variable (highest t stat and lowest P-value), followed by Accident, Owner and Miles. The model R-square – 0.96809697 – is reasonably high, with potential for even higher R-square if the model is rerun without the outliers.
To interpret the MRA model coefficients, better Trim-packaged models – EX-L and EX – have higher demands than the baseline LX model. Consumers prefer Accords that have not had any reported damages or accidents, while the one-owner units are preferable to those owned by multiple people. Also, as expected, a typical buyer is expected to pay a lesser price for a high mileage Accord.
Modeling Step 3 (Analysis of Model Estimates)
The above percentile graph shows that the dealer prices and model estimates are divergent up to the 25th percentile, beyond which the dealer prices and model estimates start to converge. The fact that the model has been predicting lower prices at the bottom end of the curve points to the above-the-market asking prices for the lower end units. On the other hand, this additionally proves that the model estimates could help both consumers and dealers to quickly converge on the same page as these estimates are independently derived. Since the private sellers frequent the mid-age market, model estimates would help them properly price their subjects as well.
The model is predicting even higher (than the asking) prices for the top-of-the-line EX-L package, signifying that the market is ready to withstand higher prices for the more robust V6 engine with factory-installed power and cosmetic upgrades, even though the manufacturer sells a disproportionately higher volume of the lighter version (assuming, of course, that the combined EX/LX 65% in this sample represents the actual rollout too). This is a common strategy manufacturers follow to keep the MSRPs low, thereby enticing a broader base of customers. Again, by having access to model estimates, dealers would be alerted to the potential under-pricing of the EX-Ls. Conversely, they would be warned of the over-pricing the other 65%, particularly the baseline LXs.
The Accident variable provides an excellent customer protection, safeguarding those who are particularly risk-averse. While the Model is agreeing with the dealer pricing for the vehicles without any reported damages/accidents, the dealers are however way over-pricing the Accords with the reported damages/accidents. Therefore, by having the model estimates placed alongside the dealer prices, consumers can save on average $2,500 (10,995 – 8,485), a wow savings and the true protection from over-pricing.
Nowadays, vehicle data reports like CarFax* and AutoCheck* are readily available in the pre-owned market, instantly alerting buyers shopping on-site or online of the many noteworthy issues like title, safety, accident, odometer, prior ownership, etc.
While the Model is confirming the dealer prices for the prior 1 and 2-owner Accords, the dealer prices are nonetheless considerably higher than the model estimates for 3 and 4-owner ones, thus significantly disadvantaging average consumers. Only the extremely knowledgeable consumers would be aware of the differences in prices at this level of detail. Thus, having the model estimates available side-by-side the dealer prices would protect average consumers and ease deal-making by eliminating all unnecessary price haggling back and forth.
The above Miles table shows the price comparison by breaking down the mileage into four equal quartile groups. The Model is revealing that the dealer prices for the two lower mileage categories are significantly above the market, though their prices in the highest mileage category are well below the market. Therefore, having access to the model values would help dealers price their inventory more accurately, without having to depend on the transposed prices between these two compensating groups. The lure of lower mileage vehicles is forcing consumers to pay an unwarranted premium which could be avoided if the model estimates were also published alongside the dealer prices.
The above table proves that the location arbitrage is virtually non-existent nationally, other that the fact that the West Coast market is seriously overpriced. Of course, considering that West Coast is not the typical Accord country, this price imbalance could be temporary, resulting from (temporary) shortage of supplies. Conversely, the South and Midwest markets are somewhat under-priced.
When the Model identifies the over-priced ones, it’s pointing to a silver lining, meaning “potential” savings. If the model values were to be reported alongside the dealer prices, buyers would immediately know the extent of potential savings. Earlier, the Model had identified the factors – baseline Trim, Accident on record, multiple prior Owners and high Mileage – that significantly lower the value of this mid-age Accord. The above over-priced data sample confirms exactly that. SL # 6 is the only one without an accident report, however satisfying the other conditions. SL # 7 and 9 units, despite accidents, have managed to maintain higher values due to the top EX-L trim, single ownership and relatively low miles.
Alternatively, when the modeling process identifies the under-priced cars, it’s pointing to some “upfront” savings for the consumers. This is an area where dealers would be most benefitted if they were to subscribe to the model estimates. While dealer prices range between $12,995 and $13,998, the Model has been predicting a much higher range – low-to-mid $15K. As the Model has already identified, dealers have been under-pricing their cream of the crop Accords, meaning the one-owner, accident-free, low-mileage, top-of-the-line EX-Ls. Again, the above under-priced sample proves the accuracy of the model. Now and then, the dealer prices could consciously be lower as the minor negatives are not captured in the modeling database. At any rate, it would be a conscious decision on the dealer’s part listing a lower (than the model estimate) price. SL # 2 and 3 – the two low-mileage top-notch EX-Ls – could fall into the aforesaid group.
Considering the high reliability and rock solid loyalty, the 2010 Honda Accord has been one of the most sought after mid-size models on the pre-owned market today.
COPYRIGHTED MATERIAL
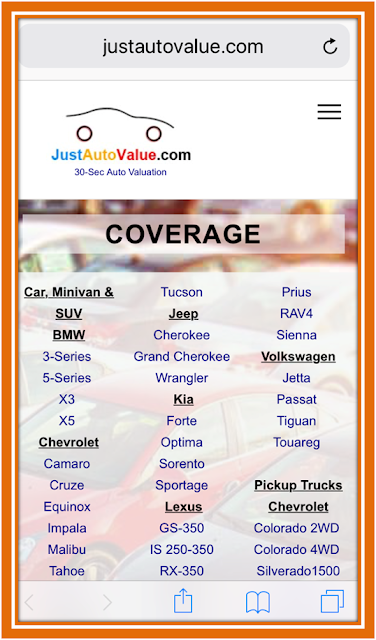
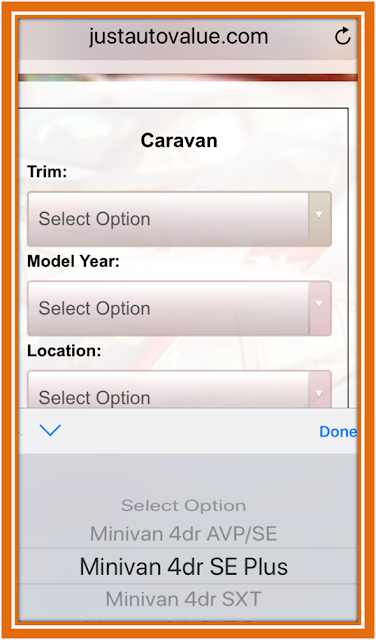
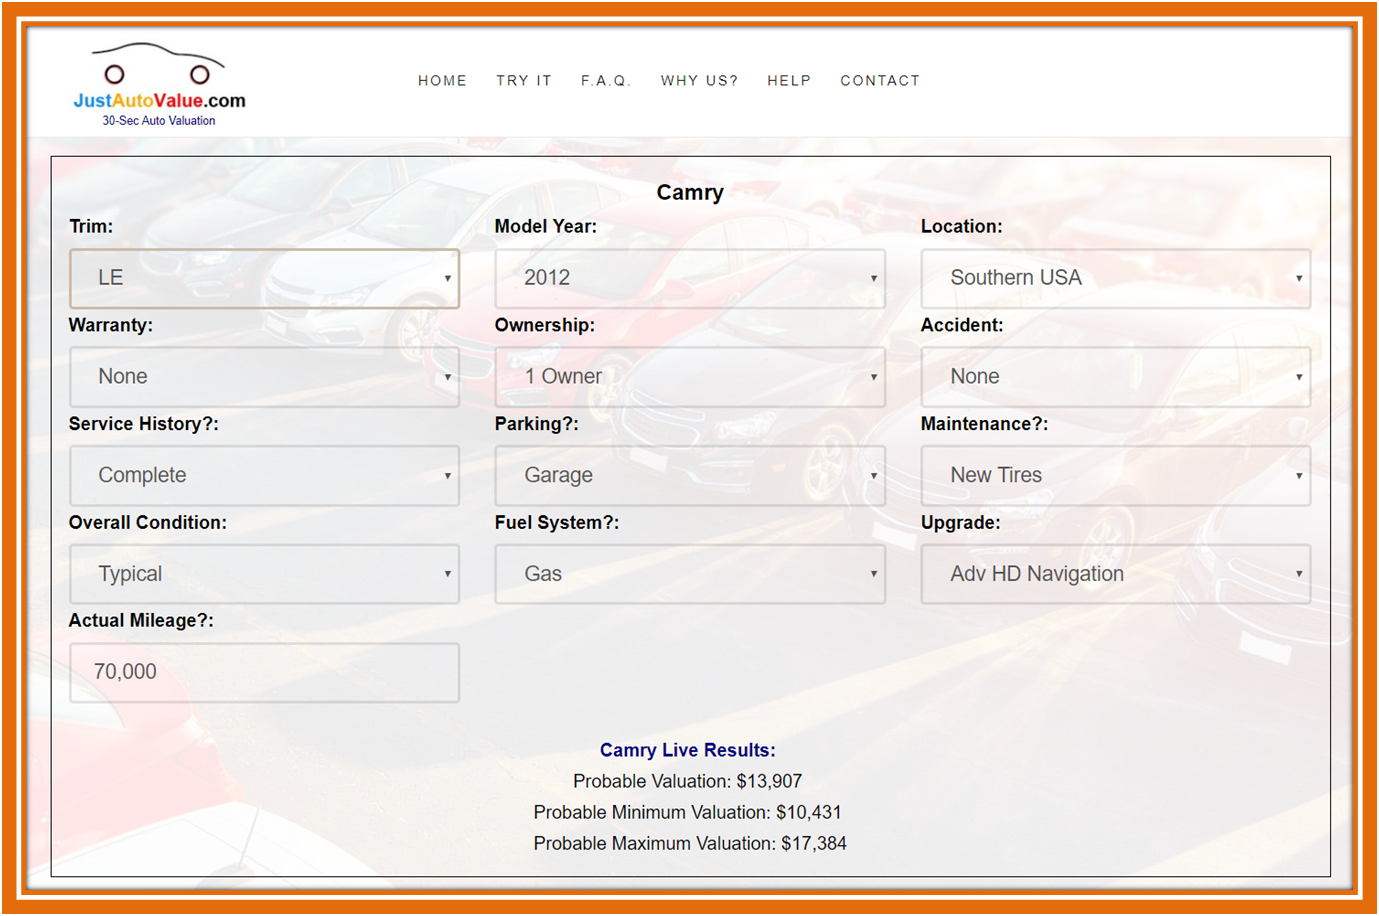
Those who are into data science or modeling can learn more about it from my recent book "Pricing Pre-owned Auto Market - A Hedonic Modeling Approach" available on Amazon (search 'Sid Som's Books'). Also, try our Free and Mobile-friendly Auto Valuation site JustAutoValue.com.